Before sampling a set of data, you must calculate the statistically appropriate sample size, and other values required by the subsequent sample and evaluate operations.
The Calculate Sample Size feature in Analytics calculates the required values for you based on input values you provide.
Calculating an appropriate sample size is critical to the validity of the subsequent sample. If the sample is not valid, or representative, you cannot reliably project the results of audit procedures you perform on the sample to the entire population.
Do not skip calculating a sample size, or guess at a sample size.
Most of the input values you use to calculate sample size are based on your professional judgment. Ensure that you fully understand the implications of the values before relying on the results of sampling in a production environment. Consult audit sampling resources, or an audit sampling specialist, if you are in doubt.
Input values affect the sample size calculated by Analytics . You can use the Calculate button in the Size dialog box to experiment with how the different input values affect the sample size.
The table below summarizes the effect of input values on sample size.
In a production environment, do not manipulate input values solely to achieve a smaller sample size. Input values should be based on your professional judgment about what is most appropriate for the data being sampled and the audit objective.
![]()
![]()
![]()
![]()
Do not include the thousands separator, or the percentage sign, when you specify values. These characters prevent the command from running, or cause errors.
The input values are explained in detail below.
Tip Clicking Calculate instead of OK allows you to experiment with different input values before outputting the results.
Note The output results are explained in detail below.ASCII Text File or Unicode Text file (depending on which edition of Analytics you are using) is the only option for File Type .
The tables below provide detailed information about the input values and output results in the Size dialog box.
Input values – Size dialog box
Your desired confidence level that the resulting sample is representative of the entire population.
For example, entering 95 means that you want to be confident that 95% of the time the sample will in fact be representative. Confidence is the complement of “sampling risk”. A 95% confidence level is the same as a 5% sampling risk.
The absolute value of the numeric sample field.
To get the absolute value, profile or generate statistics on the sample field.
The maximum total amount of misstatement that can occur in the sample field without being considered a material misstatement.
For example, entering 29000 means that the total amount of misstatement must be greater than $29,000 to be considered a material misstatement.
The total amount of misstatement that you expect the sample field to contain.
For example, entering 5800 means that you expect the total amount of misstatement to be $5,800.
The Expected Total Errors you specify must be less than Materiality . If the difference between them is too small, the error message Error rate too high for calculation appears.
In audit sampling terms, the degree of sampling precision represented by the difference is too small to be calculated for the confidence level you specified.
The maximum accumulated tainting percentages that can occur in misstated amounts in the resulting sample without exceeding the Materiality .
The Maximum Tolerable Taintings (%) value reported by Analytics can be greater than 100%.
The figure below provides an example of input values and output results when calculating sample size for monetary unit sampling.
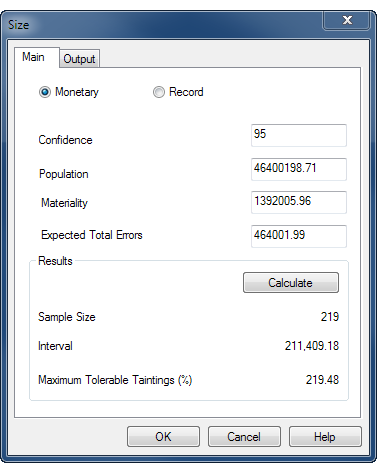
The calculation is based on the Invoices table in ACL_Rockwood.acl ( ACL DATA\Sample Data Files\ACL_Rockwood\ACL_Rockwood.acl ).
If you intend to use the evaluation feature in Analytics , you do not need to use the value reported by Maximum Tolerable Taintings (%) . Instead, you use the Upper Error Limit calculated by the evaluation feature. For more information, see Evaluating errors in a monetary unit sample.
Maximum Tolerable Taintings (%) provides one way of evaluating misstatement in a population.
If you use this method, you know in advance the threshold value reported by Analytics , before you begin audit procedures on the sampled data. If cumulative errors you observe in the course of performing the procedures exceed the threshold value, you know at that point that the sample field is materially misstated.
In an accounts receivable table you discover that a book value of $1000 should actually be $930. In a misstated amount, tainting is the percentage of the book value that the misstatement represents.
| Book value | Audit value | Overstatement | Tainting |
|---|---|---|---|
| $1,000 | $930 | $70 | 7% (70/1000) |
After performing your substantive procedures on sampled data you can sum all the individual tainting percentages from any misstated amounts. If the sum of the tainting percentages is less than or equal to the Maximum Tolerable Taintings (%) reported by Analytics , you can consider that the amounts in the sample field as a whole are not materially misstated, for your specified confidence level.
You discover three misstated amounts in an accounts receivable table, which results in the following taintings, and total tainting percentage:
| Book value | Audit value | Overstatement | Tainting |
|---|---|---|---|
| $1,000 | $930 | $70 | 7% (70/1000) |
| $2,500 | $1,500 | $1000 | 40% (1000/2500) |
| $2,750 | $2,695 | $55 | 2% (55/2750) |
| 49% (total tainting percentage) |
Let's assume the Maximum Tolerable Taintings (%) reported by Analytics when you calculated the sample size for the table was 92.30%. Because the total tainting percentage of 49% is less than 92.30%, you can conclude that the amounts in the sample field as a whole are not materially misstated, for your specified confidence level.
Evaluation using Maximum Tolerable Taintings (%) is slightly more stringent than the evaluation feature in Analytics .
If the sum of the tainting percentages marginally exceeds the Maximum Tolerable Taintings (%) value you should use the evaluation feature to confirm that the sample field is in fact materially misstated.
Analytics generates statistically valid sample sizes for most analyses. Exceptions may apply in the following situations:
Two commonly used methods of generating sample sizes are the Poisson and the binomial distributions. Analytics generates sample sizes using the Poisson distribution.
For typical data sets of a thousand or more records, the Poisson and the binomial distributions generate nearly identical sample sizes. For populations of under a thousand records, sample sizes determined with the Poisson distribution tend to be slightly larger and therefore more conservative than sizes determined with the binomial distribution. The binomial distribution adjusts the sample size downward for small populations but the Poisson distribution does not. With very small populations, the sample size generated by the Poisson distribution can actually exceed the population size.
When calculating sample sizes in Analytics , recognize that for record sampling of small data sets, the sample size may be larger than you need. This larger sample size does not present an obstacle to analysis because it is common practice to manually oversample small populations.